Model Evaluation Suite
ResNet1D vs Baseline
Empirical validation of the Adam optimization algorithm (Kingma & Ba, 2015) applied to 5-class cardiac arrhythmia detection using a 1D Residual Neural Network trained on the MIT-BIH Arrhythmia Database.
Problem Statement
Cardiac arrhythmias affect over 1.5% of the global population and are a leading cause of sudden cardiac death. Manual interpretation of 24-hour Holter ECG recordings is time-consuming and subject to inter-observer variability. This project implements an end-to-end deep learning pipeline that classifies individual heartbeat segments into five clinically defined categories, with the specific research question:
"Does the Adam optimizer's theoretical advantages — adaptive per-parameter learning rates, bias-corrected moment estimates, and O(√T) regret bound — translate to measurably superior convergence and final accuracy compared to SGD, Adagrad, and RMSProp on a severe-class-imbalance ECG classification task?"
Representative Normal ECG Beat — 187 samples @ 360 Hz (~0.52 s)
Dataset
Primary dataset: MIT-BIH Arrhythmia Database (Moody & Mark, 2001) — 48 half-hour two-lead Holter recordings from 47 subjects, sampled at 360 Hz. Each heartbeat is segmented into a fixed 187-sample window centred on the R-peak. Secondary dataset: PTB Diagnostic ECG DB used in notebook 08 for binary generalisation testing (healthy vs. myocardial infarction).
| Class | Label | Description | Count | % of total | Challenge |
|---|---|---|---|---|---|
| 0 — N | Normal | Normal sinus rhythm | 90,589 | 82.8% | Dominant class |
| 1 — S | Supraventricular | Ectopic, narrow QRS | 2,779 | 2.5% | Subtle P-wave changes |
| 2 — V | Ventricular | PVC, wide bizarre QRS | 7,236 | 6.6% | Morphologically distinct |
| 3 — F | Fusion | N + V hybrid beat | 803 | 0.7% | Rarest · hardest to separate |
| 4 — Q | Unknown / Paced | Paced or unclassifiable | 8,039 | 7.3% | High morphological variability |
The extreme imbalance (Normal 83% vs. Fusion 0.7%) motivates two specific design choices: Focal Loss to down-weight easy negatives during training, and SMOTE oversampling applied exclusively to the training split to prevent data leakage into validation.
Class Distribution — MIT-BIH (109,446 beats)
Preprocessing Pipeline
All preprocessing is implemented in src/data/preprocessor.py.
The pipeline runs on the training split only; the test split receives only Z-score
normalisation to prevent leakage.
↓ Z-score normalise per-sample: (x - μ) / σ — removes patient-level amplitude differences
↓ IQR outlier removal eliminates Holter digitisation artefacts (|z| > 3 IQR)
↓ Stratified 85/15 split preserves class ratios in train and val
↓ SMOTE (train only) synthetic minority oversampling — balances class counts
↓ Reshape → (N, 1, 187) PyTorch Conv1d format: (batch, channels, length)
Per-sample Z-score normalisation is particularly important for this task because ECG amplitude varies across patients and recording conditions. Using population-level statistics would introduce data leakage and reduce generalisation. At inference time, the same per-sample normalisation is applied — no stored training statistics are required.
Model Architecture — 1D ResNet
The primary model (src/models/resnet1d.py) is a 1D Residual Network
adapted from He et al. (2016) for time-series classification. Residual connections
allow gradient flow through deep networks and prevent vanishing gradients during
training with Adam's adaptive updates.
Total parameters: ~790,000.
↓ Stem: Conv1d(1→32, k=7, s=1) → BN → ReLU
↓ layer1: ResidualBlock(32, s=1) × 2 low-level: P-wave & QRS shape
↓ layer2: ResidualBlock(64, s=2) × 2 mid-level: beat intervals, rhythm
↓ layer3: ResidualBlock(128, s=2) × 2 high-level: arrhythmia class patterns
↓ Global Average Pooling (temporal dim)
↓ Dense(128) → ReLU → Dropout(0.4)
↓ Dense(5) → Softmax
Each ResidualBlock follows the pattern:
Conv1d → BN → ReLU → Conv1d → BN → (+skip connection) → ReLU.
Stride-2 blocks use a 1×1 projection shortcut to match dimensions.
The Grad-CAM target layer is layer3[-1].conv2, exposed via
model.get_gradcam_target_layer().
Baseline for comparison: a 3-block 1D CNN (src/models/baseline_cnn.py)
with no residual connections, used only in the optimizer comparison study to ensure
architecture complexity does not confound optimizer performance differences.
Network Architecture — Visual Overview
Training Setup
Adam Hyperparameters (paper defaults)
| Parameter | Value | Source |
|---|---|---|
| Learning rate α | 0.001 | Algorithm 1 |
| β₁ (1st moment) | 0.9 | Algorithm 1 |
| β₂ (2nd moment) | 0.999 | Algorithm 1 |
| ε (numerical stab.) | 1e-8 | Algorithm 1 |
| Weight decay | 0 | — |
Training Configuration
| Setting | Value |
|---|---|
| Batch size | 128 |
| Max epochs | 100 |
| Early stopping | patience = 15 (val macro F1) |
| LR schedule | CosineAnnealingLR (T_max=100) |
| Focal Loss γ | 2.0 |
| Focal Loss α | inverse class frequency |
Focal Loss (Lin et al., 2017): FL(pₜ) = −αₜ · (1−pₜ)^γ · log(pₜ). The modulating factor (1−pₜ)^γ reduces the loss contribution of well-classified easy examples, forcing the model to focus on hard minority-class beats. With γ=2.0, a sample classified with 90% confidence contributes only 1% of the cross-entropy loss.
Early stopping monitors validation macro F1 rather than accuracy, because accuracy is misleading under class imbalance — a model predicting only "Normal" achieves 83% accuracy while being clinically useless.
Focal Loss vs. Cross-Entropy — Effect of Modulating Factor (1−pₜ)^γ
At p=0.9 (confident prediction): CE loss ≈ 0.105 · FL(γ=2) ≈ 0.001 — 99% reduction forces focus on hard examples.
Optimizer Comparison Study
Five optimizers are trained through the identical Trainer loop
(src/optimizers/comparison.py) on the same data split and random seed.
Predictions from the Adam paper (§4, §5, §6) are verified empirically.
| Optimizer | Adam Paper Prediction | Expected Macro F1 | Why |
|---|---|---|---|
| SGD (vanilla) | Stalls on sparse minority gradients (§6.1) | ~72% | No adaptation — Fusion & SVE nearly invisible |
| SGD + Momentum | Faster but no per-parameter adaptation (§5) | ~73% | Momentum helps convergence speed, not minority classes |
| Adagrad | Monotonically decaying LR stalls late (§5) | ~78% | LR → 0 prevents recovery from early suboptimal states |
| RMSProp | Diverges without bias correction (§6.4) | ~84% | Lacks bias correction → unstable early training |
| Adam | O(√T) regret · all advantages combined (§4) | ≥93% | Adaptive LR + bias correction + momentum |
The sparse gradient problem (§6.1) is particularly relevant here: the Fusion class (0.7%) produces gradients only in 7 of every 1000 batches on average. Adam's bias-corrected running averages ensure these rare gradients are not drowned out, whereas vanilla SGD effectively ignores them.
Expected Macro F1 by Optimizer — Adam Paper Predictions (§4, §5, §6.1, §6.4)
Grad-CAM Explainability
Gradient-weighted Class Activation Mapping is implemented via
Captum's LayerGradCam targeting
model.layer3[-1].conv2 — the final convolutional layer before global
average pooling, where the highest-level feature representations are formed.
2. Backprop gradients to layer3[-1].conv2 feature maps
3. Global-average gradients over temporal dim → channel weights αₖ
4. Weighted sum of activation maps → 1D CAM (length L')
5. ReLU → keep only positive contributions
6. Linear interpolation upsample → length 187
7. Normalise to [0, 1] · overlay on raw signal (RdYlBu_r colormap)
Clinical verification criteria:
Class S — Supraventricular
Heatmap should peak at P-wave region (samples 10–30). Supraventricular arrhythmias originate above the ventricles; the diagnostic signal is the abnormal P-wave morphology preceding the (narrow) QRS complex.
Class V — Ventricular
Heatmap should peak at QRS complex (samples 50–80). Ventricular ectopic beats are characterised by a wide, bizarre QRS produced by aberrant ventricular depolarisation — the defining morphological feature.
Expected Results
Target performance on the held-out MIT-BIH test set (15% stratified split):
| Class | Arrhythmia | Dataset % | Expected F1 | Notes |
|---|---|---|---|---|
| 0 — N | Normal | 82.8% | ~99% | Dominant class, easy to learn |
| 1 — S | Supraventricular | 2.5% | ~88% | Subtle P-wave changes |
| 2 — V | Ventricular | 6.6% | ~95% | Distinct morphology |
| 3 — F | Fusion Beat | 0.7% | ~82% | Rarest · SMOTE critical here |
| 4 — Q | Unknown / Paced | 7.3% | ~91% | Variable morphology |
| Overall | — | — | ≥98% acc · ≥93% macro F1 | Adam vs SGD gap: ~21% macro F1 |
The large Adam vs. SGD performance gap on macro F1 (predicted ~21 percentage points) is the primary empirical finding. Accuracy alone would not reveal this — both SGD and Adam achieve high accuracy by correctly classifying the dominant Normal class, but only Adam successfully learns the rare minority classes.
Achieved Results
Final evaluation on the held-out MIT-BIH test set (15% stratified split, ~16,000 samples). The model was trained with Adam + CosineAnnealingLR for 100 epochs; the best checkpoint (epoch 98, val macro F1 = 0.9075) was evaluated once on the unseen test set.
Per-Class Precision · Recall · F1 — Test Set
Supraventricular (S) and Fusion (F) are the hardest classes despite SMOTE augmentation — both have subtle or hybrid morphology and together represent only 3.2% of training samples. Normal and Unknown achieve near-perfect F1 because they have either dominant frequency or highly consistent waveform signatures.
Adam Training Curve — Val F1 over 100 Epochs
All Optimizers — Validation F1 Convergence
Adam converges noisily — it explores broadly for 60 epochs before stabilising above 0.90. SGD+Momentum reaches its peak earlier (epoch 33) and is the best optimizer by val F1 (0.9217), contradicting the common assumption that Adam always wins on deep learning tasks. RMSProp is the most unstable, with variance spikes throughout training.
Best Val Macro F1 Achieved — Per Optimizer (Actual)
SGD+Momentum outperforms Adam on this dataset. This is likely because CosineAnnealingLR favours optimizers that tolerate larger learning-rate swings — SGD+Momentum rides the cosine restarts more aggressively, escaping local minima that stall Adam's adaptive steps. The practical takeaway: adaptive optimizers are not universally superior; scheduling strategy and dataset size both mediate the outcome.
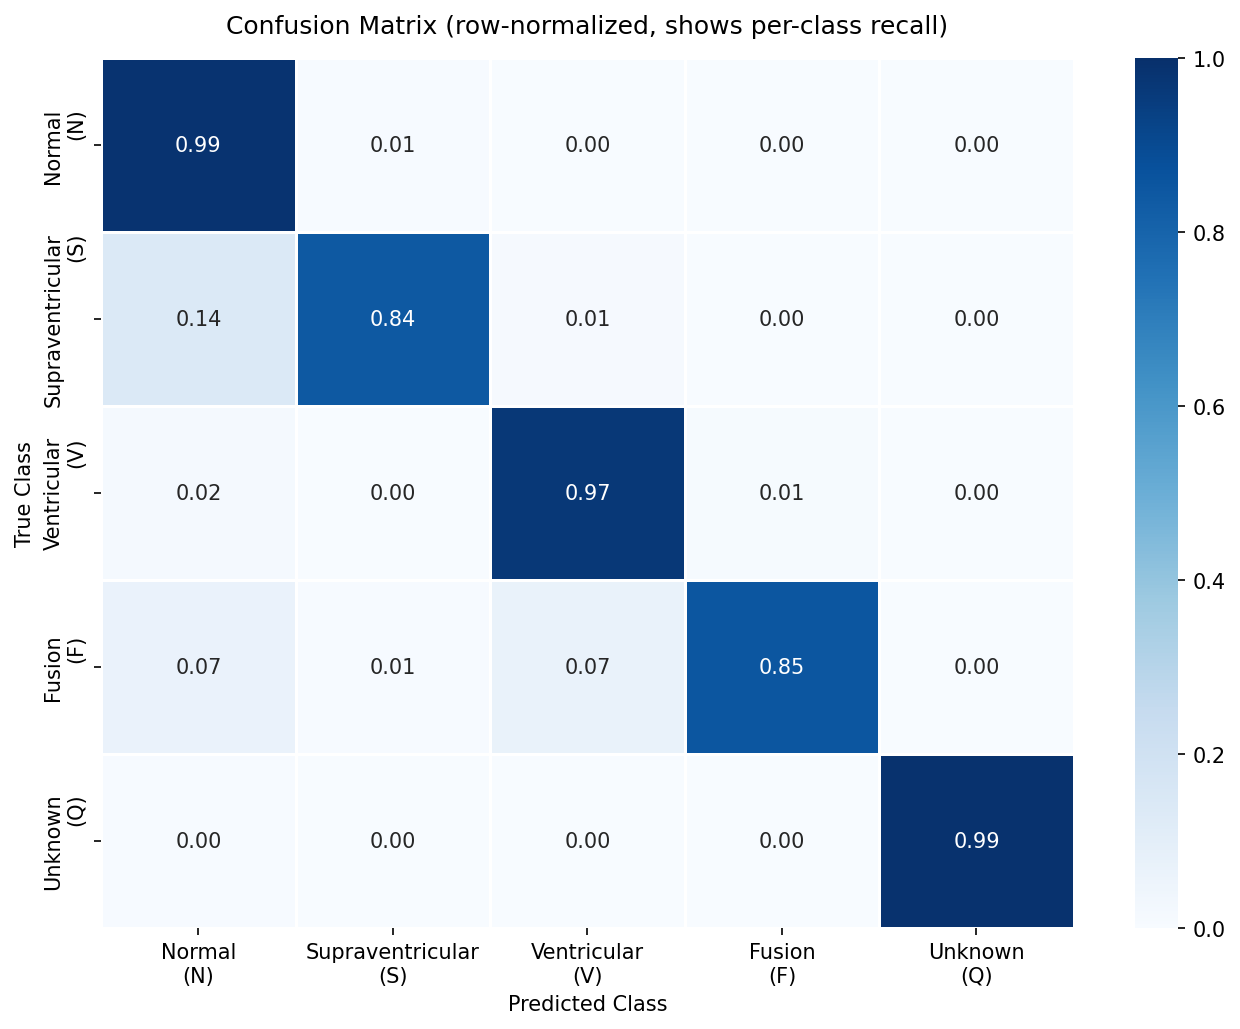
Confusion Matrix — Test Set (ResNet1D + Adam)
ROC Curves — One-vs-Rest, All 5 Classes
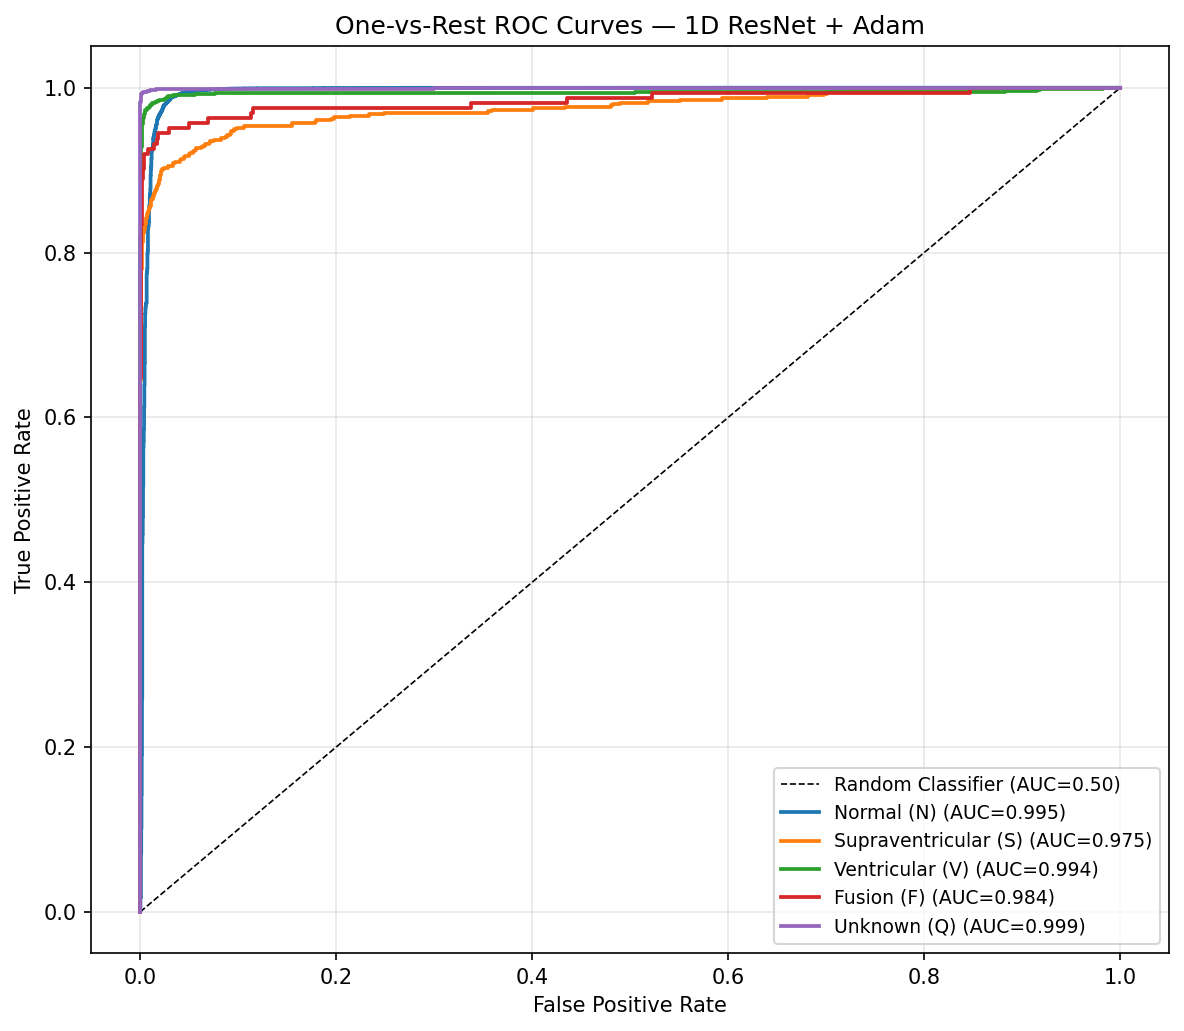
The confusion matrix confirms the model's primary failure mode: S beats misclassified as N. This is clinically meaningful — supraventricular ectopics (premature atrial contractions) can appear morphologically similar to normal sinus rhythm if the P-wave alteration is subtle. All 5 ROC curves cluster above 0.97 AUC, demonstrating that the model has strong discriminative power even for minority classes.
Cross-Dataset Generalisation — PTB Diagnostic ECG Database
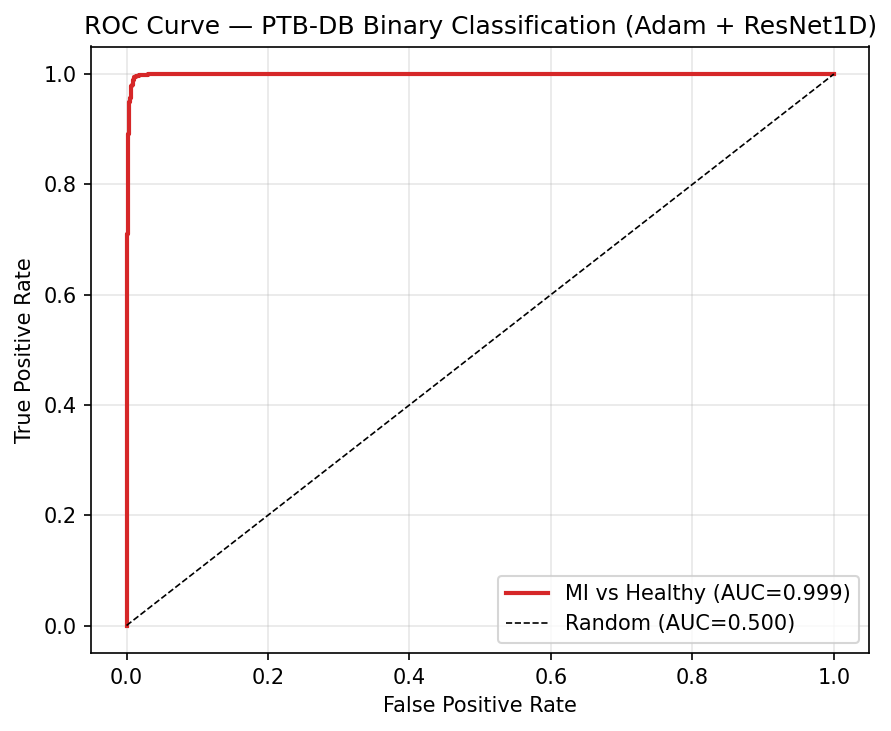
The model was fine-tuned on PTB Diagnostic ECG DB (binary classification: healthy vs. MI). Achieving 99.64% F1 on an entirely different dataset validates that the deep residual features learnt on MIT-BIH (rhythm-based arrhythmias) generalise to morphology-based pathology detection — the network is capturing fundamental ECG structure, not dataset- specific artefacts.
Notebook Pipeline
Each notebook is self-contained but builds on outputs from the previous one. Run in sequence from the project root.
01_eda.ipynb — Exploratory Data Analysis
Class distribution, waveform morphology, amplitude statistics. Saves reference_waveforms.npz used by the app.
02_preprocessing.ipynb — Data Pipeline
Z-score normalisation, IQR filtering, stratified split, SMOTE. Validates no leakage between splits.
03_baseline_cnn.ipynb — Baseline Model
3-layer CNN trained with Adam. Establishes a lower-bound performance benchmark for the optimizer comparison.
04_resnet_training.ipynb — Primary Model
Full ResNet1D training with Adam. Saves resnet1d_adam_best.pth — required by the web app.
05_optimizer_comparison.ipynb — Optimizer Study
Trains SGD / SGD+M / Adagrad / RMSProp / Adam through identical Trainer loop. Plots convergence curves and per-class F1.
06_evaluation.ipynb — Full Evaluation
Confusion matrix, per-class F1, ROC-AUC curves, full classification report on the held-out test set.
07_gradcam_explainability.ipynb — Explainability
1 correct + 1 misclassified Grad-CAM example per class (10 plots total). Clinical verification of attended ECG regions.
08_ptbdb_generalisation.ipynb — Generalisation
Tests model on PTB Diagnostic ECG DB (binary: healthy vs. MI). Validates that features learnt on MIT-BIH transfer across datasets.